#58 Iλ+
While experimenting in the lab, Ryland tests a hypothesis that the Astrophage are drawn to the infrared signature of Venus, by modifying a light source until it reaches the planet’s average temperature of 462 °C. However, the Astrophage are completely uninterested in his “artificial Venus”, forcing him to conclude that the IR signature is not what attracts them.
This leads Ryland to his next (correct) hypothesis: Astrophage are instead drawn to the spectral signature of Venus’s carbon dioxide, as this is a chemical resource required for their metabolism and reproduction.
Spectroscopy is a valuable tool in our modern understanding of the cosmos, including in our search for potentially habitable worlds beyond Earth. We learn about the temperature, composition, and motion of astronomical objects using spectroscopy, which relies upon our fundamental understanding of how light and matter interact with each other. A spectrum in this context refers to the range of wavelengths emitted, absorbed, or transmitted by particular materials. The realization that there exists, due to the interactions between electrons and nuclei, a unique spectrum associated with each element and molecule, led to the popularity of spectroscopy in both chemistry and astronomy.
The NASA image below outlines three types of spectra important to astronomy: continuous, emission, and absorption.
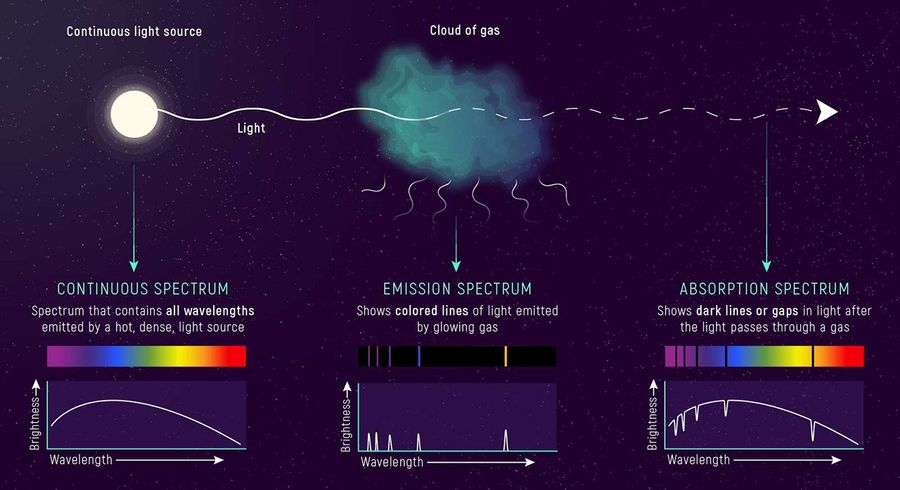
A fourth category known as a transmission spectrum involves studying the wavelengths of starlight filtered out by a planet’s atmosphere, and then comparing that filtered starlight to the pure, unfiltered spectrum of the star. This technique is used with instruments such as those aboard the James Webb Space Telescope to determine whether exoplanets contain signatures of water and other molecules (see WASP-39 b transmission spectra for an example).
Because spectroscopy, at its core, involves separating light into its component wavelengths, anyone who has looked upon a rainbow has utilized spectroscopy in their daily life — a fact that Ryland’s more attentive students would surely know.
That’s what spectroscopy is all about.
05.053